
If you’ve just started preparing for the IELTS exam, IELTS Writing Task 1 can feel confusing. You open a practice paper, see a bar chart, and wonder — what exactly do I write? How long? In what format?
This guide answers all of that. You’ll learn exactly what Writing Task 1 asks you to do, how to structure your response, what examiners look for, and how to avoid the mistakes that cost most beginners two full band scores.
No sample answers here. Just real, practical guidance that actually teaches you the skill.
Table of Contents
- What Is IELTS Writing Task 1?
- Academic vs. General IELTS Writing Task 1
- The 4 Types of Academic Task 1 Reports
- How to Structure Every Task 1 Response
- What Examiners Actually Grade You On
- Step-by-Step: How to Write a Task 1 Response
- IELTS Data Reports — Graphs, Charts, Tables
- IELTS Process Reports — Diagrams and Flowcharts
- IELTS Map Reports — Before and After Maps
- IELTS General Writing Task 1 — Letters
- Common Mistakes Beginners Make
- Useful Language for Task 1
- FAQ
What Is IELTS Writing Task 1?
IELTS Writing Task 1 is the first part of the IELTS Writing test. You get 60 minutes for the entire Writing section, and examiners recommend spending about 20 minutes on Task 1.
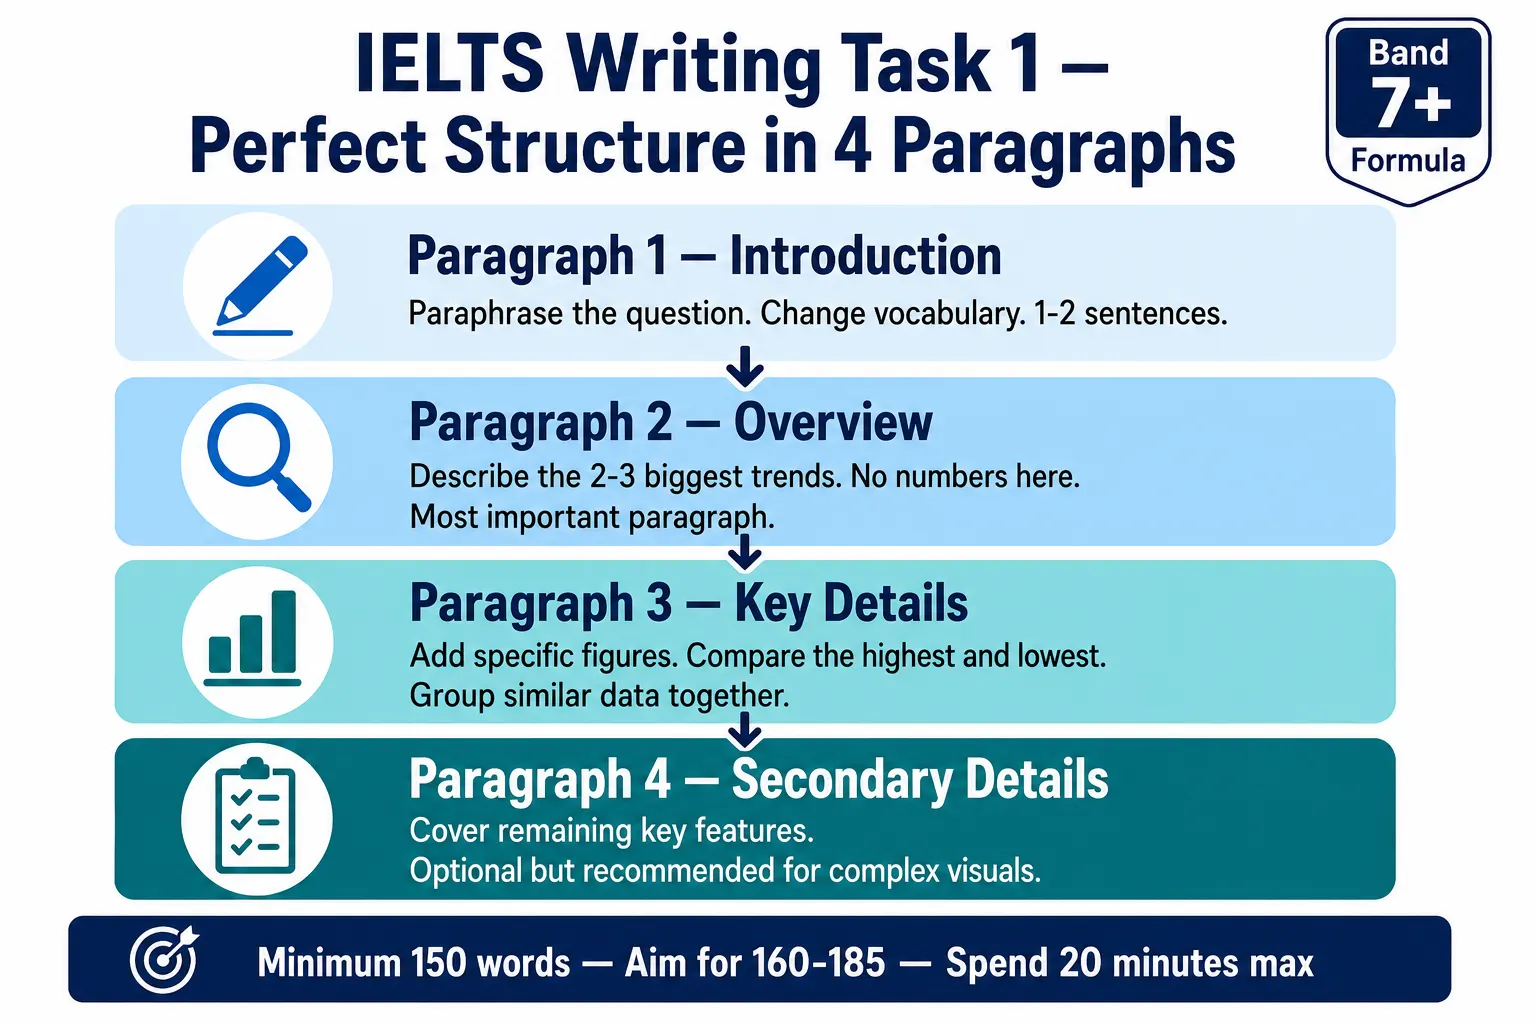
You must write a minimum of 150 words. Most strong responses land between 160 and 185 words. Going over 200 words wastes your time; Task 1 carries less weight than Task 2.
Task 1 is worth one-third of your Writing band score. Task 2 is worth two-thirds. So while Task 1 matters, don’t spend 40 minutes on it.
The core job in Task 1: describe what you see. You’re not giving an opinion. You’re not analyzing causes. You’re reporting key information in a clear, organized way.
Academic vs. General IELTS Writing Task 1
The IELTS exam comes in two versions, and Task 1 is different for each.
Academic IELTS Writing Task 1 gives you a visual — a graph, chart, table, diagram, or map — and asks you to summarize the information. You report data, describe a process, or compare two maps.
IELTS General Writing Task 1 gives you a situation and asks you to write a letter. You might write to a landlord about a broken appliance, to a friend planning a visit, or to a manager requesting time off.
Both versions share the same word count minimum (150 words) and the same time recommendation (20 minutes). But the approach, tone, and structure are quite different — and you need to prepare for the right one.
The 4 Types of Academic Task 1 Reports
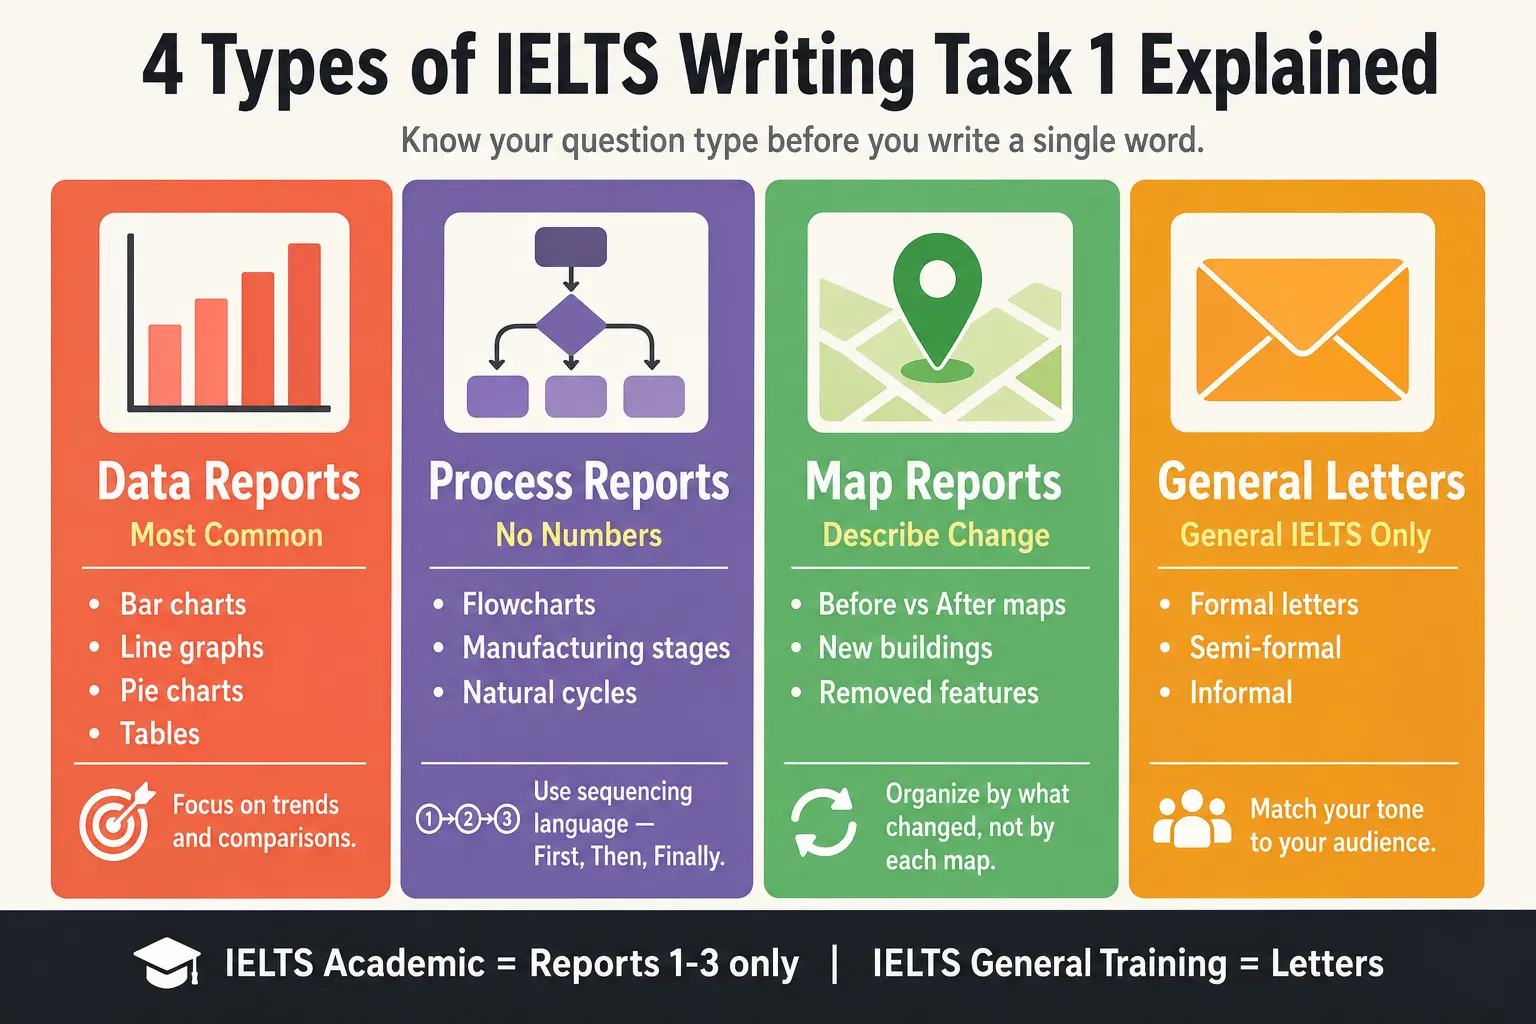
Academic Task 1 breaks down into four main report types. Knowing these saves time because each type has a slightly different approach.
1. Data Reports These include bar charts, line graphs, pie charts, and tables. You describe trends, compare figures, and highlight the most significant data points.
2. Process Reports These show how something works or how something is made — usually as a flowchart or a series of labeled stages. Unlike data reports, there are no numbers to describe.
3. Map Reports These show two maps of the same location at different points in time. You describe what changed — new buildings, road layouts, removed features.
4. Combined Visuals Sometimes you get two charts together — for example, a bar chart and a pie chart. You must cover both and link them where relevant.
Most IELTS test-takers encounter data reports most often. Process and map reports appear less frequently, but they still come up.
How to Structure Every Task 1 Response
Good structure is what separates a Band 5 response from a Band 7. The format below works for nearly every Task 1 question.
Paragraph 1 — Introduction (1-2 sentences) Paraphrase the task prompt. Don’t copy the question word for word. Change the vocabulary and sentence structure.
Example: If the prompt says “The bar chart shows electricity consumption in five countries between 2000 and 2020,” you might write: “The bar chart illustrates how much electricity five nations used over a twenty-year period from 2000 to 2020.”
Paragraph 2 — Overview (2-3 sentences) This is the most important paragraph. It describes the biggest, most obvious trends without using specific numbers. Think of it as a summary of the whole visual.
Examiners specifically look for an overview. Missing it is one of the most common reasons test-takers get stuck at Band 5.
Paragraph 3 — Key Details (4-6 sentences) Now you bring in the specific figures. Describe the most significant data points, compare where relevant, and use numbers accurately.
Paragraph 4 — Secondary Details (optional, 3-4 sentences) For longer or more complex visuals, use a second detail paragraph to cover the remaining key features. Don’t try to describe every single number — select the most meaningful ones.
What Examiners Actually Grade You On
IELTS Writing Task 1 is graded on four criteria. Each counts for 25% of your Task 1 band score.
Task Achievement Did you complete the task? Did you include an overview? Did you cover the key features? Did you write at least 150 words?
Coherence and Cohesion Does your response flow logically? Do you use linking words appropriately? Is it easy to follow from one sentence to the next?
Lexical Resource Do you use a variety of vocabulary? Can you avoid repeating the same words? Do you use collocations naturally?
Grammatical Range and Accuracy Do you use a mix of simple and complex sentences? Do you make consistent grammar errors, or is your writing mostly accurate?
Most beginners score well on Task Achievement (because it’s clear what to write) but lose points on Lexical Resource and Grammatical Range. Those two areas reward consistent practice.
Step-by-Step: How to Write a Task 1 Response
Follow these six steps every time you sit down to write a Task 1 response.
Step 1: Spend 2 minutes analyzing the visual Before you write a single word, look at the chart carefully. What is being measured? What time period does it cover? What are the biggest changes or differences? Who or what is being compared?
Step 2: Identify the top 3-4 key features You cannot describe everything. Pick the most striking trends — the highest value, the lowest value, the biggest change, an unexpected result. These form the backbone of your response.
Step 3: Write your introduction Paraphrase the task description. Change at least 50% of the vocabulary. Keep it to one or two sentences.
Step 4: Write your overview Describe the two or three most obvious patterns without using numbers. This paragraph should make sense to someone who hasn’t seen the chart.
Step 5: Write your detail paragraphs Support your overview with specific figures. Group related data together — for example, all the countries with rising figures in one paragraph, falling figures in the next.
Step 6: Check your work (2-3 minutes) Read for obvious errors. Check that your overview is there. Make sure you haven’t copied the question word for word. Confirm you’ve hit 150 words.
IELTS Data Reports — Graphs, Charts, Tables
IELTS data reports are the most common type of Academic Task 1 question. They always involve numbers and usually show change over time or comparison between groups.
Bar charts compare categories — usually across time or between countries/groups. Look for the highest and lowest bars, and track how they shift from one period to another.
Line graphs show trends over time. Focus on overall direction (rising, falling, fluctuating), peak points, and convergence or divergence between lines.
Pie charts show proportions as parts of a whole. They’re almost always paired with another visual, like a table or a second pie chart from a different year.
Tables contain more data than other visuals. Resist the urge to describe every cell. Identify the most extreme values and the most interesting comparisons.
A strong data report always includes approximate language. Use words like “approximately,” “roughly,” “around,” and “just over” when describing figures. This shows flexibility with numbers and makes your writing sound more natural.
IELTS Process Reports — Diagrams and Flowcharts
Process diagrams show how something works or how something is produced. Common topics include manufacturing, natural cycles, recycling systems, and water treatment.
Unlike data reports, process reports have no numbers. Your entire job is to describe stages in order.
What to include in a process report:
- An introduction paraphrasing the task (what process is shown, how many stages)
- An overview noting whether the process is natural or man-made, and how many key stages it contains
- A detailed paragraph or two walking through each stage in order, using sequencing language
Useful sequencing language for process reports:
- First / First of all / Initially
- Then / Next / Following this
- After that / Subsequently / At this stage
- Finally / Lastly / In the final stage
The passive voice is common in process descriptions because we’re describing what happens to materials, not what people actively do. For example: “The raw material is heated before being transferred to the next chamber.”
Aim for 160-175 words. Process reports don’t need a lengthy conclusion — just cover every stage clearly.
IELTS Map Reports — Before and After Maps
Map report questions show two versions of the same place — one from an earlier time and one from a later time. You describe what changed.
These questions trip up many beginners because they’re tempted to describe what they see in each map separately, rather than focusing on the changes. Always organize your response around change.
What to focus on in map reports:
- What features were added (new roads, new buildings, new facilities)
- What features were removed (demolished buildings, cleared areas)
- What stayed the same (unchanged structures or areas)
- The general transformation of the area (more urban, more green, more commercial)
Location language you need:
- In the north/south/east/west of the area
- To the left/right of the main road
- Adjacent to / next to / opposite
- The northern section / the central part / the eastern edge
Tense tip: Use past tense for the older map (“there was a farmhouse”) and present tense for the current map (“there is now a supermarket”). Use “by [year]” to anchor time changes.
IELTS General Writing Task 1 — Letters
If you’re taking the General Training IELTS, your Task 1 is a letter-writing task. The prompt describes a situation and tells you the purpose of your letter.
The three letter types:
Formal letters go to people you don’t know or to organizations — a company, a local authority, a university. Use formal language, no contractions, and a professional tone.
Semi-formal letters go to someone you know in a professional context — a manager, a teacher, a neighbor you haven’t met properly. Moderately formal tone.
Informal letters go to friends or family. Use a friendly, conversational tone, first names, and contractions.
Standard letter structure:
- Salutation (Dear Sir/Madam or Dear [Name])
- Opening sentence explaining why you’re writing
- Body paragraphs addressing each bullet point in the prompt
- Closing sentence
- Sign-off (Yours faithfully / Yours sincerely / Best wishes / Take care)
Most Task 1 letter prompts give you three bullet points. Address all three. Missing even one will drop your Task Achievement score significantly.
Common Mistakes Beginners Make
These errors appear in almost every beginner’s Task 1 response. Avoiding them will immediately push your score higher.
Copying the question word for word Your introduction must paraphrase. Use synonyms: “shows” → “illustrates,” “number of” → “quantity of,” “between 2010 and 2020” → “over a ten-year period.”
Missing the overview An overview is not optional. Examiners explicitly look for it. Write it as your second paragraph, before any specific numbers.
Describing every single data point You don’t have time, and it doesn’t help your score. Select the most significant features. A 170-word response focused on the right data beats a 220-word response that lists every number.
Using opinion language Never write “I think” or “in my opinion” in Academic Task 1. You’re a reporter, not a commentator.
Inventing data If you can’t read a figure exactly, use approximations. Never make up numbers. Examiners know the chart better than you do.
Forgetting to group data logically Don’t jump between subjects randomly. Group countries with similar trends together, or describe one time period fully before moving to the next.
Useful Language for Task 1
Build a toolkit of phrases that work across many different Task 1 questions.
Introducing the visual:
- The chart/graph/diagram illustrates…
- The figure below compares…
- The data shows the changes in… over a period of…
Describing upward trends:
- Rose / increased / climbed / grew / went up / surged
- A sharp/gradual/steady rise in…
Describing downward trends:
- Fell / dropped / declined / decreased / went down / plummeted
- A significant/slight/gradual fall in…
Describing stability:
- Remained stable / stayed constant / leveled off / plateaued
- There was little change in…
Making comparisons:
- In contrast / by comparison / while / whereas / on the other hand
- Significantly higher/lower than / almost double / roughly half
Approximating figures:
- Approximately / roughly / around / just over / just under / nearly
FAQ
How long should my IELTS Writing Task 1 response be?
Write at least 150 words. Most strong responses are between 160 and 185 words. Going above 200 words isn’t necessary and uses time better spent on Task 2. Never go below 150 you’ll be penalized for Task Achievement.
Do I need a conclusion in IELTS Writing Task 1?
No. Task 1 doesn’t need a separate conclusion. The overview paragraph (usually paragraph two) acts as your summary. Some test-takers add a brief closing sentence, but it’s not required and doesn’t help your score.
What’s the difference between an overview and a conclusion?
An overview describes the most obvious patterns visible in the data — without specific numbers. A conclusion usually restates your argument. In Task 1, you’re reporting, not arguing. Write an overview, not a conclusion.
Can I give my opinion in IELTS Writing Task 1?
No. Academic Task 1 is a purely descriptive exercise. Phrases like “I believe” or “it is clear that this trend is concerning” are inappropriate. Save your opinions for Task 2.
What if the chart is really complicated and I don’t understand it?
Start with what you do understand. Identify the obvious high and low points. Write your overview based on the clearest trends. Then fill in details you can see clearly. You don’t have to describe everything — just the most significant features. Examiners reward smart selection of data, not exhaustive listing.
Mr. Sanjay Smart has taught IELTS for the last 30 years and has helped more than 15,000 students clear the IELTS and study abroad. He is also the creator of SMART IELTS, an AI-driven IELTS preparation portal, for which he has lent his content creation, UX Design and Prompt Engineering skills.
Leave a Reply